PowerBI Reports
Microsoft's PowerBI software is directly supported by Rapid Platform. PowerBI Reports enables you to quickly explore, visualise, and analyse the data contained in your Rapid site.
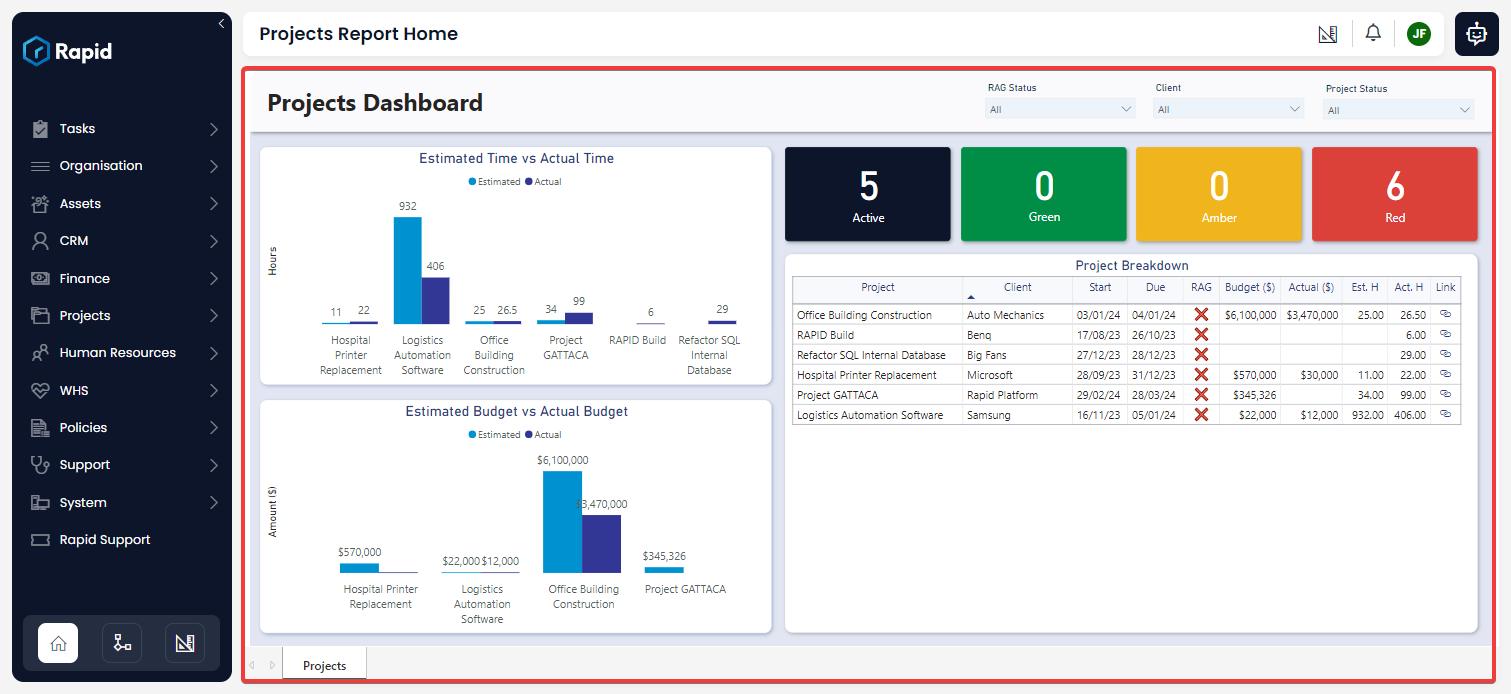
Pictured: an example PowerBI report from Rapid Standard's Projects module.
PowerBI Reports are attached to a page. Clicking on a a component of a report, such as an item in a table, or a section of a graph, will "drill down" into that section of data and reveal information specific to the element being examined.
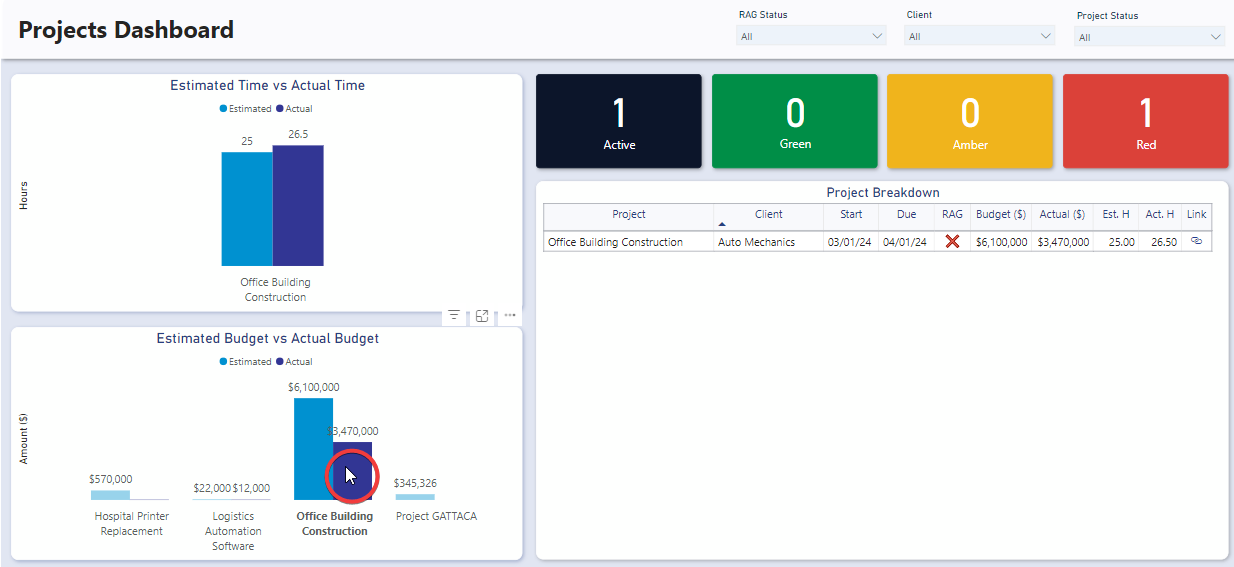
Pictured: The same report once the "Office Building Construction" project has been selected on the lower bar graph. Now all of the visuals change to reflect this single project. Clicking on the same section of bar graph again will return to the "all projects" view.
Slicers
Note that PowerBI Reports also contain Slicers which allows the data to "zoom in" on particular information. These slicers appear as drop-down boxes in the upper-right corner of the report.
For example, we can "slice" the report so that it only displays projects with a particular RAG Status, or all of the projects for a particular Client, or all of the projects that have a particular Project Status.
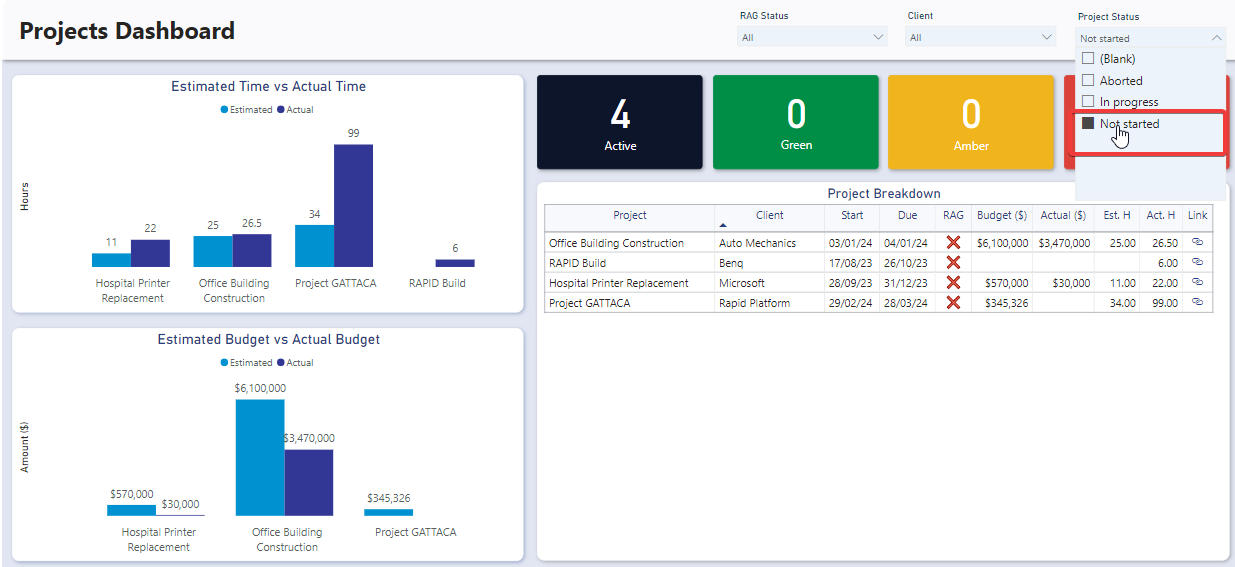
Slicers can also be combined together. For example, you could choose to select "All the reports with a "Red" RAG Status, that have a Project Status of "In Progress".
How to Enable Editing for a Report
All PowerBI Reports in Rapid are able to have editing "enabled". This provides users with the ability to make small improvements to a PowerBI report without leaving the Rapid site.
To enable editing:
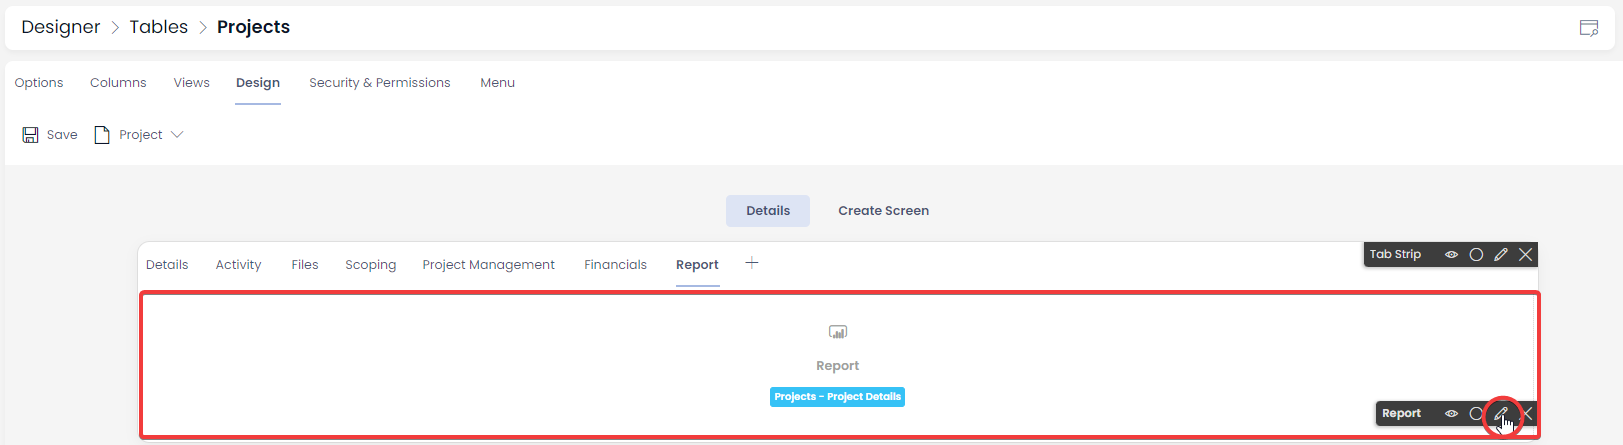
- Go to a Report using Explorer.
- Switch to the Designer application using the Designer button in the upper-right corner of the site.
- Under the Design tab, ensure you are viewing the correct page or tab where the Report is located. In this example, the Report is contained in a tab labelled "Report"
- Hover your mouse over the Report component, and select the pencil icon to edit the component.
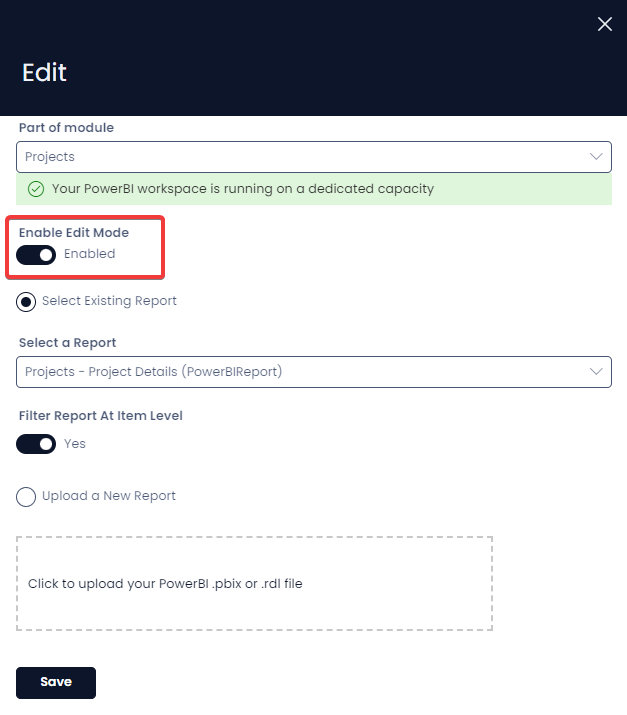
- In the Edit side panel that opens, change the Enable Edit Mode toggle to Enabled.
- Save changes.
- Return to Explorer. The next section explains how to edit a PowerBI report once editing is enabled.
Editing a PowerBI Report
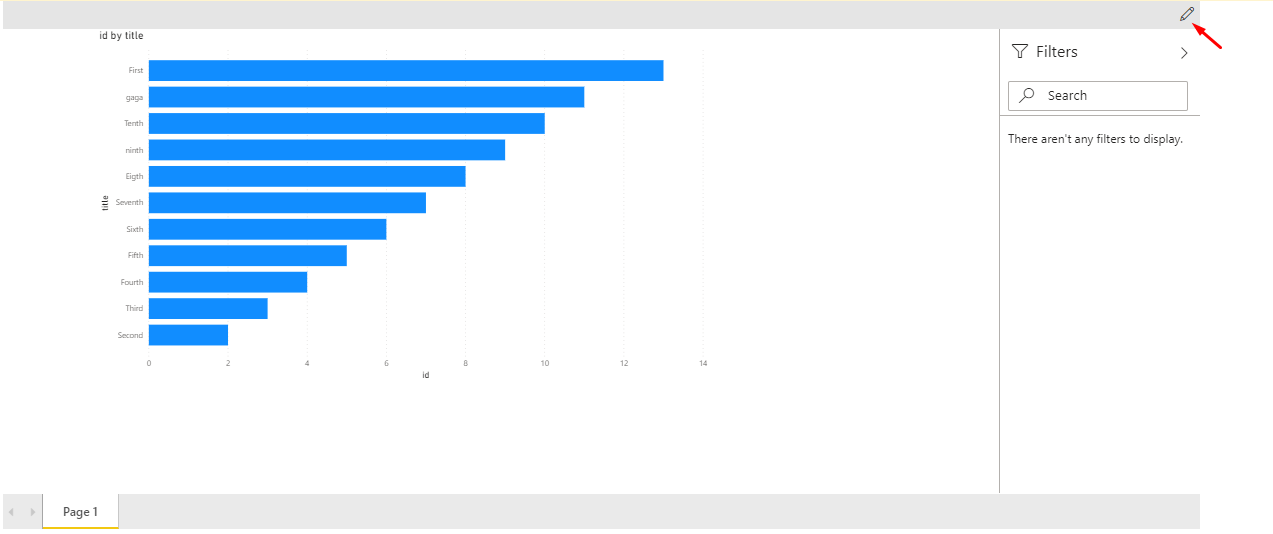
If editing is enabled, there will be an Edit button in the top right of the PowerBI Component. This button will allow you to edit and save the report. Being in Edit mode gives you full control over the visualisations of the report. The only thing which is not possible, is the changing of the data source for the report.
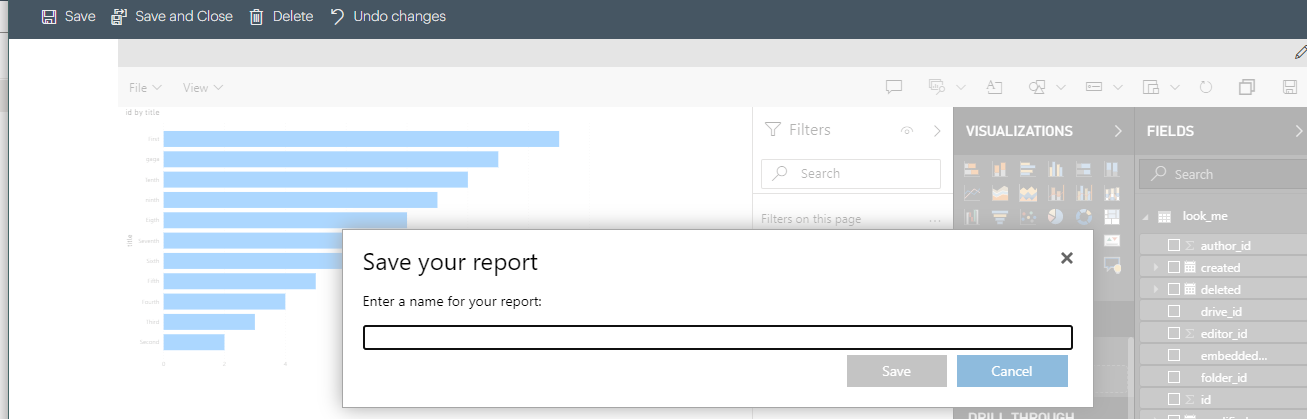
Saving an Edited Report
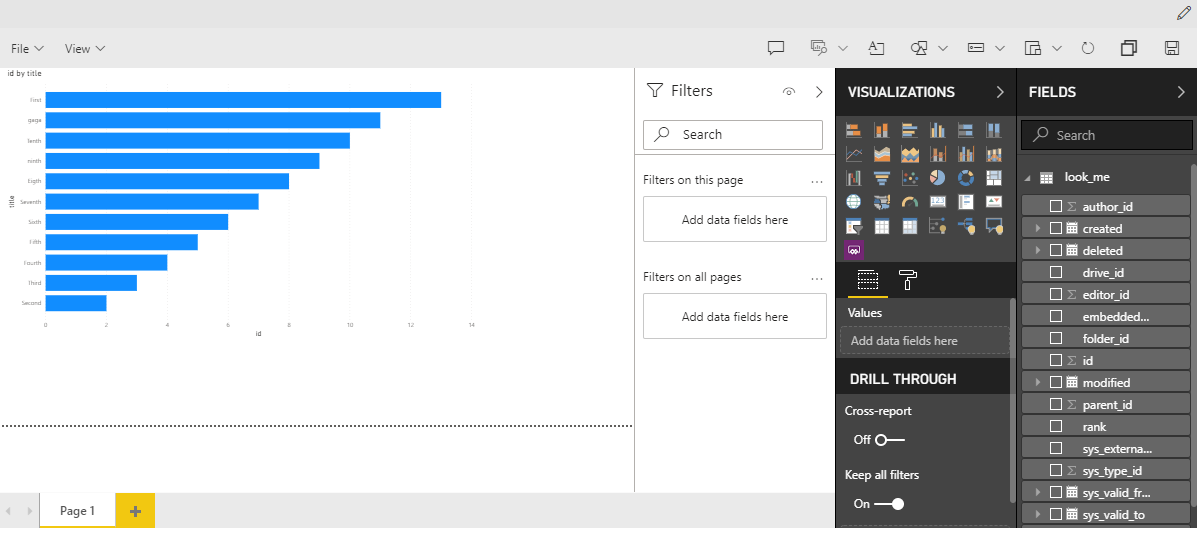
To save a report, press the File dropdown and then press Save. This will ensure that any changes made to the report are saved.
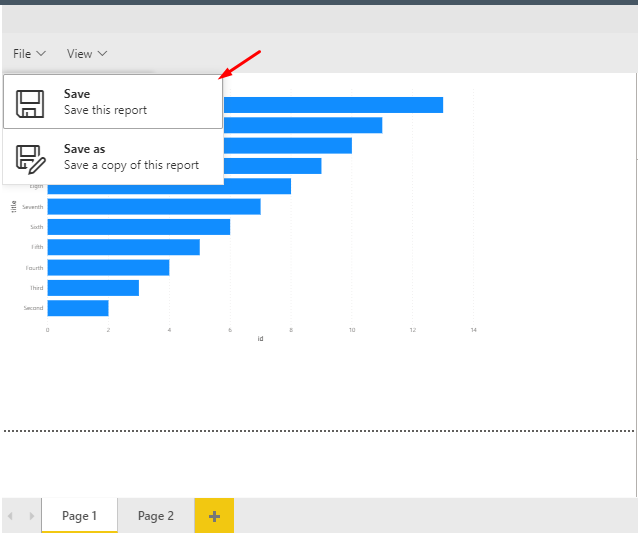
To save a copy of the report, press Save as. This will create a copy of the report as of the time of the save and store it in the current workspace under the inputted name